|
|
|
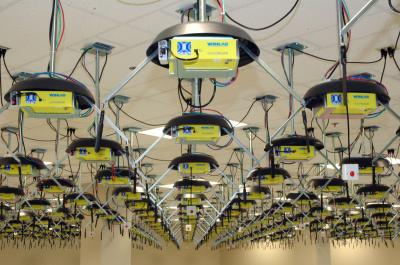
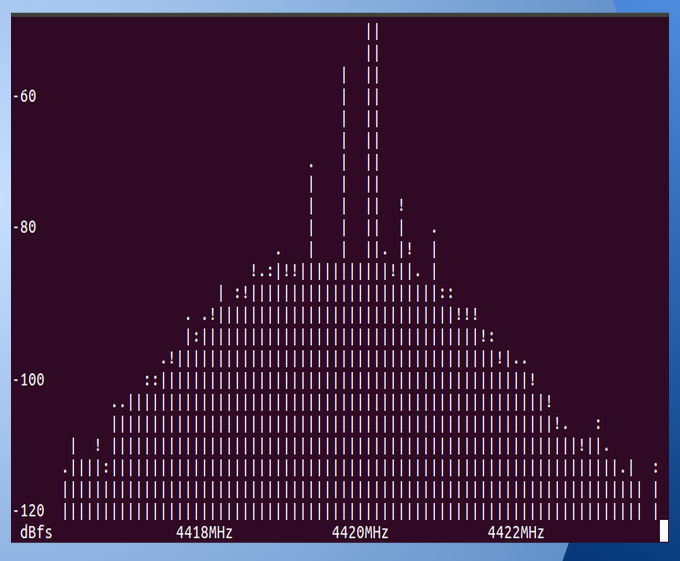
The noise in the ORBIT lab
|
the signal received by a node
|
}}}
{{{
#!html
|
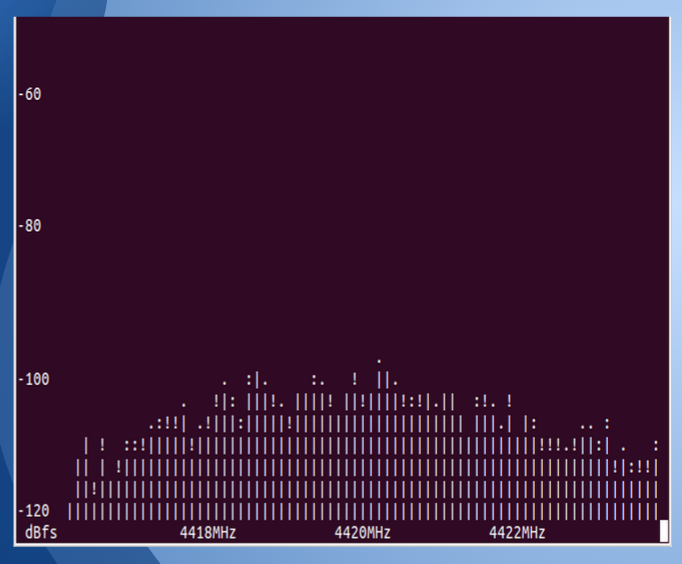
Analysis: The left image shows signal reception when there is no signal transmitted. This is the noise that is present while we conduct experiments in the ORBIT room. The peak that is visible in the right image is the frequency that the transmitted signal is received at the receiver nodes.
|
}}}
{{{
#!html
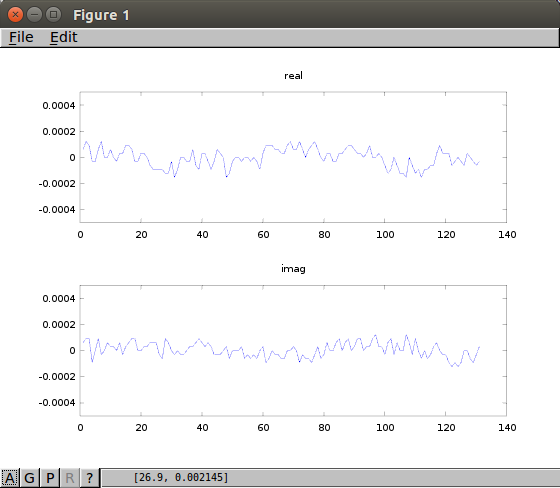
Experiment two: I/Q Samples
IQ samples are often used in RF applications. In signal processing, I/Q samples are the real and imaginary components of a transmitted signal. The in-phase component is the "i" and the out of phase component, shifted by 90 degrees, is "q". These samples were used to calculate the power of the signal and figure out the relationship between signal power and distance.
|
|
|
Real and Imaginary Signals
|
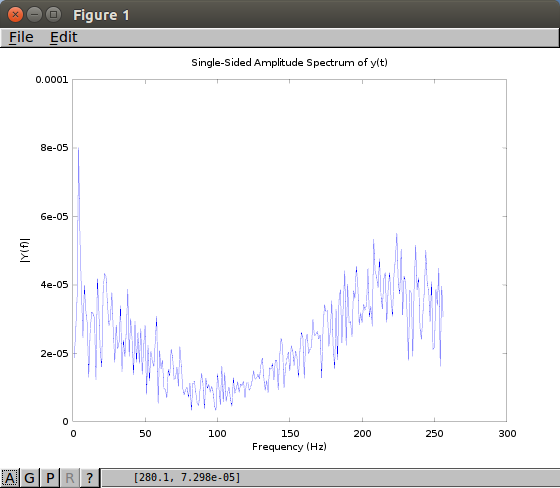
Verifying Reception using FFT
|
}}}
'''Analysis:''' We used USRPs to collect the IQ samples that are portrayed in Figure 1. The graph has time on the x axis and amplitude on the y axis for both the real and imaginary components of the signal. Figure 2 verifies the reception of this signal using Fast Fourier Transform in Matlab. IQ samples are often used for modulation and demodulation of the signal that is being analyzed. We used these samples to calculate the power of the signal at known distances.
{{{
#!html
Experiment Three: Calculating power
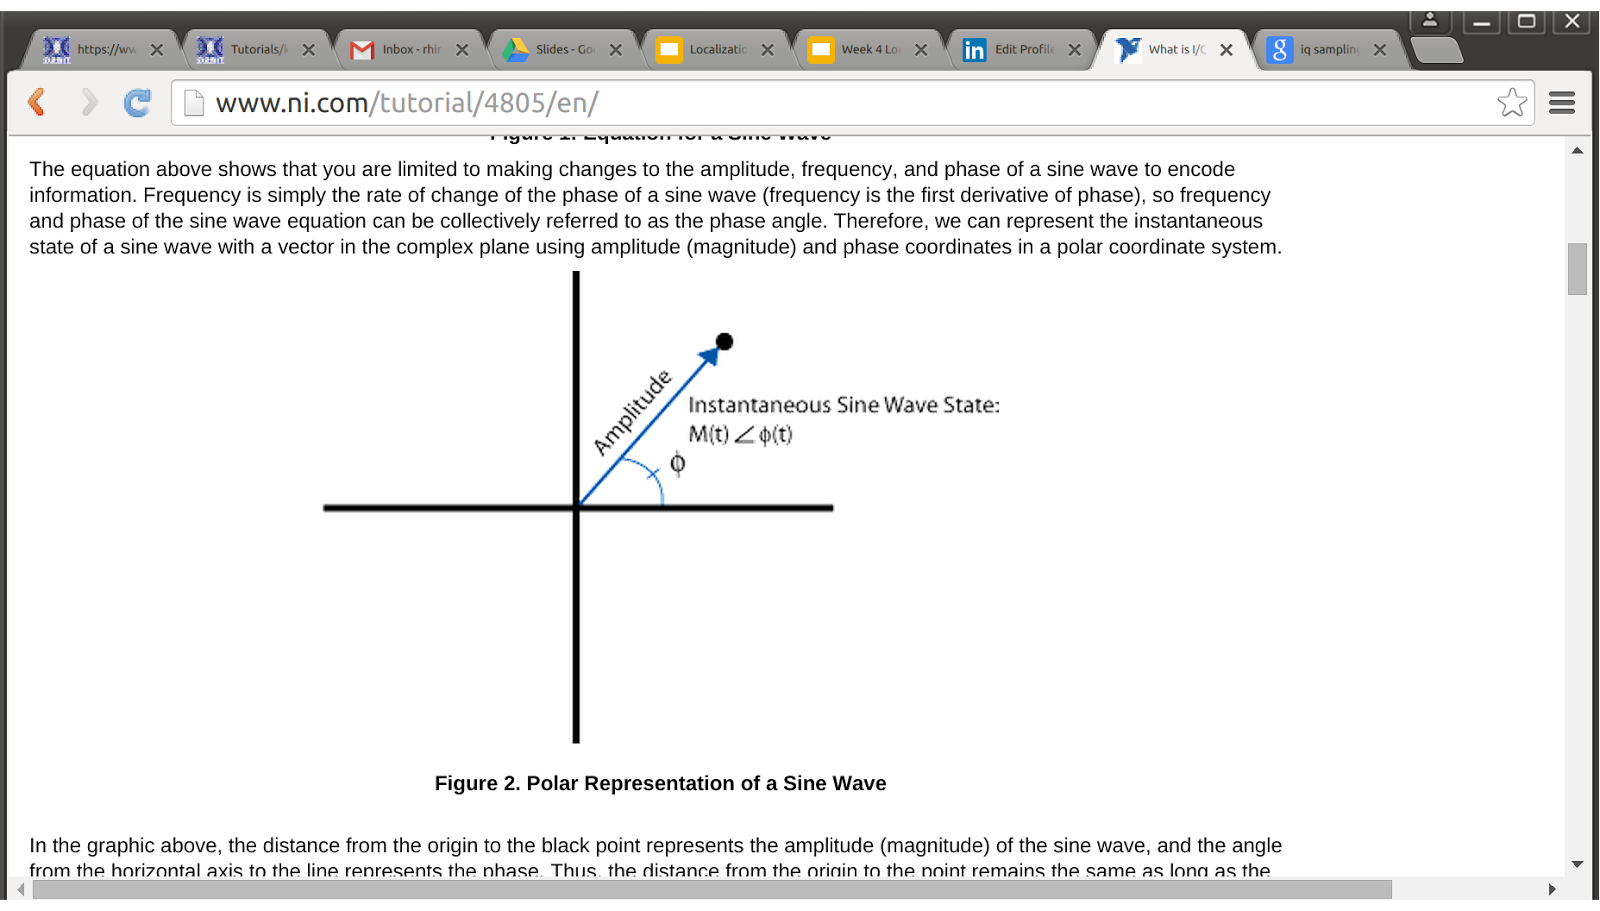
Calculating signal amplitude and power is the next step in the process. The IQ samples, as mentioned above, gives the real and imaginary amplitude (y-axis) as it is related to time. Therefore, using the real amplitude on the x axis and the imaginary amplitude on the y-axis would result in the amplitude of the signal at a given time (hypotenuse). We can also calculate power from the similar calculation.
|
|
|
Amplitude using IQ samples
|
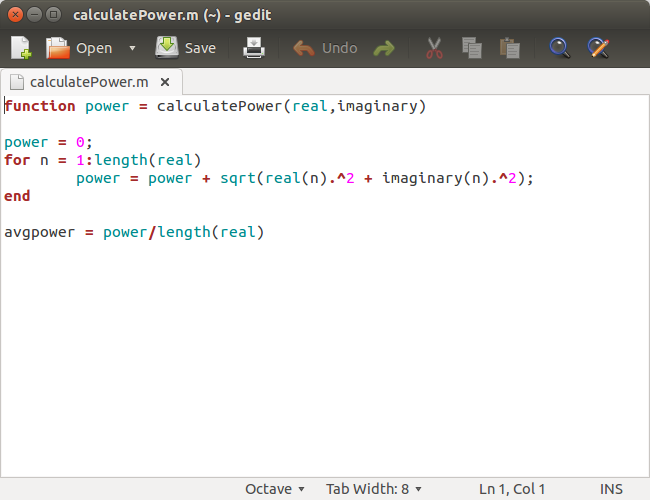
Power Program
|
Analysis: The figure on the left is the main principle of this power program. Using the phase, frequency and the phase angle of the sine wave, we can figure out the power of a signal by graphing the real amplitude on the x axis and the imaginary amplitude on the y axis. The hypotenuse is the amplitude of the signal. In this manner, we can figure out the power of the signal at each of the times in the domain using the program on the right. Using the average power, thereby cancelling out interference and propagation errors, we can figure out each of the powers at each distance between the receiver and the transmitter. The next step is to figure out the relationship between the two.
}}}
{{{
#!html
Experiment four: Relating Signal to noise ratio to distance
Signal to noise ratio is an important part in this localization process. To maintain a high SNR at higher distances means a greater chance of better localization data since there is more signal to collect and analyze. Even in the real world, people look for gadgets and devices with a higher SNR since that provides them with greater aural experience. Due to these reasons, it is very important to analyze SNR to validate the results and conclusions of the experiments.
|
|
|
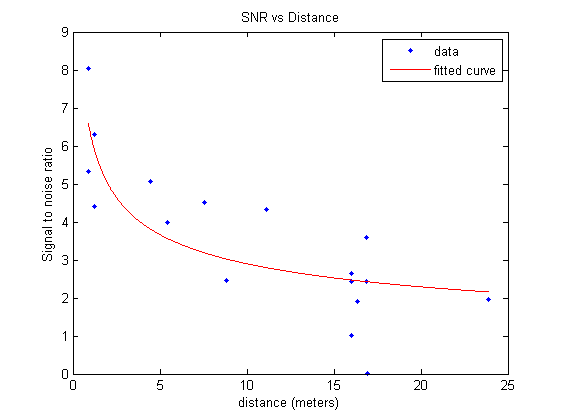
Signal-to-Noise ratio versus distance and the fitted curve(red)
|
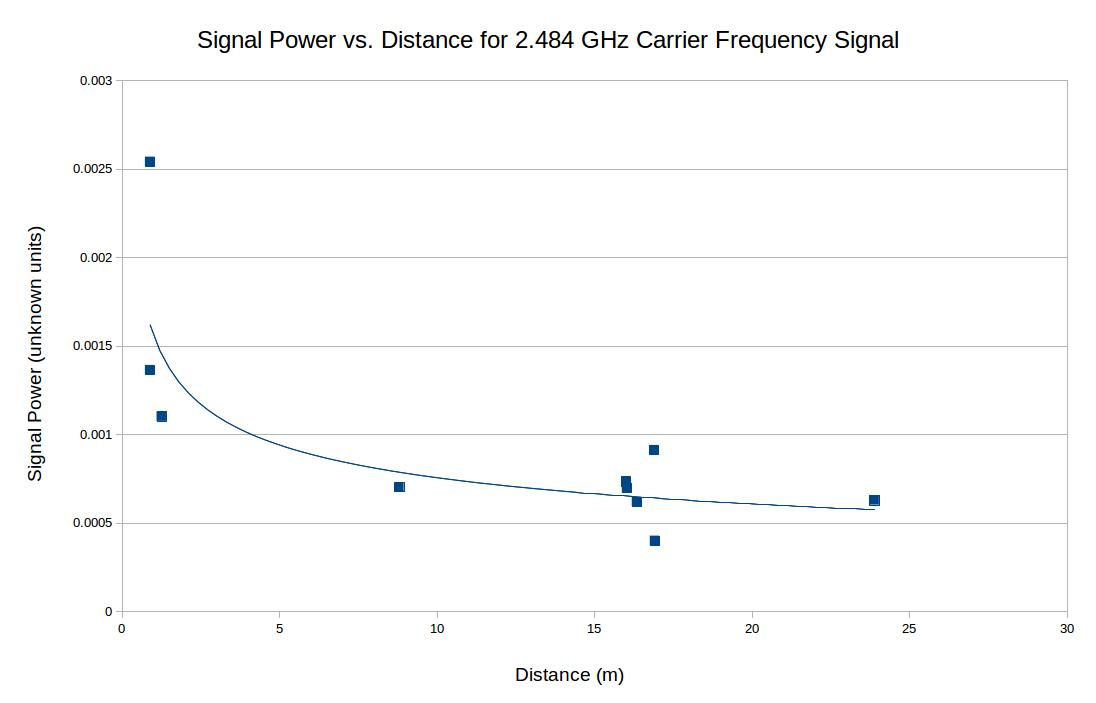
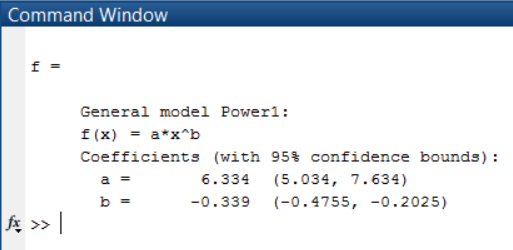
Power vs. Distance
|
Using the measured signal power, along with the distance between the transmitted and receiver, we obtained a signal amplitude-distance pair. We many of these pairs using different transmitters and receivers. We then plotted these items on a graph and found the exponential fit for the graph, as shown below.
|
|
Analysis: As shown in this experiment, the line of best fit follows a generally negative and exponential curve but some of the points are no where close to the curve. The scattering of the data points signify either an error in signal processing or simply not enough data points. We believed the latter might have had a hand in this error.
|
}}}
=== Weekly Presentations ===
Presentations are done on a weekly basis before other research interns or professors. Presentations include the group's accomplishments over the past week as well as goals for the following week
[https://docs.google.com/presentation/d/19tk2BQUCDE6SibGhI5q5ZbgrDVxeivjv-o5k8SRUtpU/pub?start=false&loop=false&delayms=3000 Week 2][[BR]]
[https://docs.google.com/presentation/d/1bB5xOKHx_YjLfJ1QgAFkz9POWl7zakhP11L4NGwn4Mg/pub?start=false&loop=false&delayms=3000 Week 3][[BR]]
[https://docs.google.com/presentation/d/1Zwrn0vNEuN4WQPvoh9i3Pk9lSppQn_kekqOq8mlOKdM/pub?start=false&loop=false&delayms=60000 Week 4][[BR]]
[https://docs.google.com/presentation/d/1g_KbZgF6W24HXhJNMXTMtkahgETWTUDOlhRXyfhY3hA/pub?start=false&loop=false&delayms=3000 Week 5][[BR]]
[https://docs.google.com/presentation/d/1I1gc6wtnZkyP5FN9h_qYw-3CHTYzYk9VVXQfDYBt-Ps/pub?start=false&loop=false&delayms=5000 Week 6] [[BR]]
[https://docs.google.com/presentation/d/1uMwQwDnEYL5DdNjgX7N-VyOxOZOs_KBcetloV3CQlbA/pub?start=false&loop=false&delayms=5000 Week 7] [[BR]]
[https://docs.google.com/presentation/d/1VErJIzLNoOnpdwJVy60t8QTDD7V3giSe0EcwfRldJS0/pub?start=false&loop=false&delayms=5000 Week 8][[BR]]
[https://docs.google.com/presentation/d/1vls9I32fbq7ubQY-pouM0mt68GfNYfKto1SNjZ_iURA/pub?start=false&loop=false&delayms=5000 Week 9][[BR]]
[https://docs.google.com/presentation/d/1bl6XcSzHVppZVYgLfC7Zobgx1fosXx3bSCTkBhmmabg/edit?pli=1#slide=id.p Final Week][[BR]]
=== Team ===
{{{
#!html

|

|

|
Rahul Hingorani
University of Michigan
Industrial/Electrical Engineering |
Vineet Shenoy
Rutgers University
Electrical and Computer Engineering |
Karan Rajput
Rutgers University
Electrical and Computer Engineering |
}}}
{{{
#!html
}}}