
Match Visualization
Table of Contents
- DARPA Spectrum Challenge
- DARPA Spectrum Challenge Q&A
- Tutorial for Hurdle3-like experiment
- Tournament game example !#1
- Match Execution Framework (Post Preliminary)
- Bot Images
- Tournament Scripts
- Match Visualization
- Calibration Reports (2014-03-13)
- Image Validation Procedure (Preliminary Torunament)
- Image Validation Procedure (Final Tournament)
DARPA Spectrum Challenge visualization consist of a set of HTML 5 (i.e. browser) based visualization tools that relies heavily on websockets and requires access to monitoring nodes in the ORBIT infrastructure. For the end user, the only way to gain this access is through ssh tunneling since the console ports 6100 - 6113 are not open for outside access. Once a user has an approved (and current) time slot, the following SSH command (assuming Linux/Unix/BSD based system) can be used to establish required tunnels:
ssh -L 6100:10.50.10.10:6100 -L 6101:10.50.10.10:6101 -L 6102:10.50.10.10:6102 -L 6103:10.50.10.10:6103 -L 6104:10.50.10.10:6104 -L 6105:10.50.10.10:6105 -L 6106:10.50.10.10:6106 -L 6107:10.50.10.10:6107 -L 6108:10.50.10.10:6108 -L 6109:10.50.10.10:6109 -L 6110:10.50.10.10:6110 -L 6111:10.50.10.10:6111 -L 6112:10.50.10.10:6112 -L 6113:10.50.10.10:6113 username@console.grid.orbit-lab.org
Most popular Windows ssh clients PuTTY can be similarly configured for tunneling.
Competitive Match Visualization
 Once required tunnels are established, competitive matches can be visualized by pointing your Chrome (other browsers are not guaranteed to work) browser at:
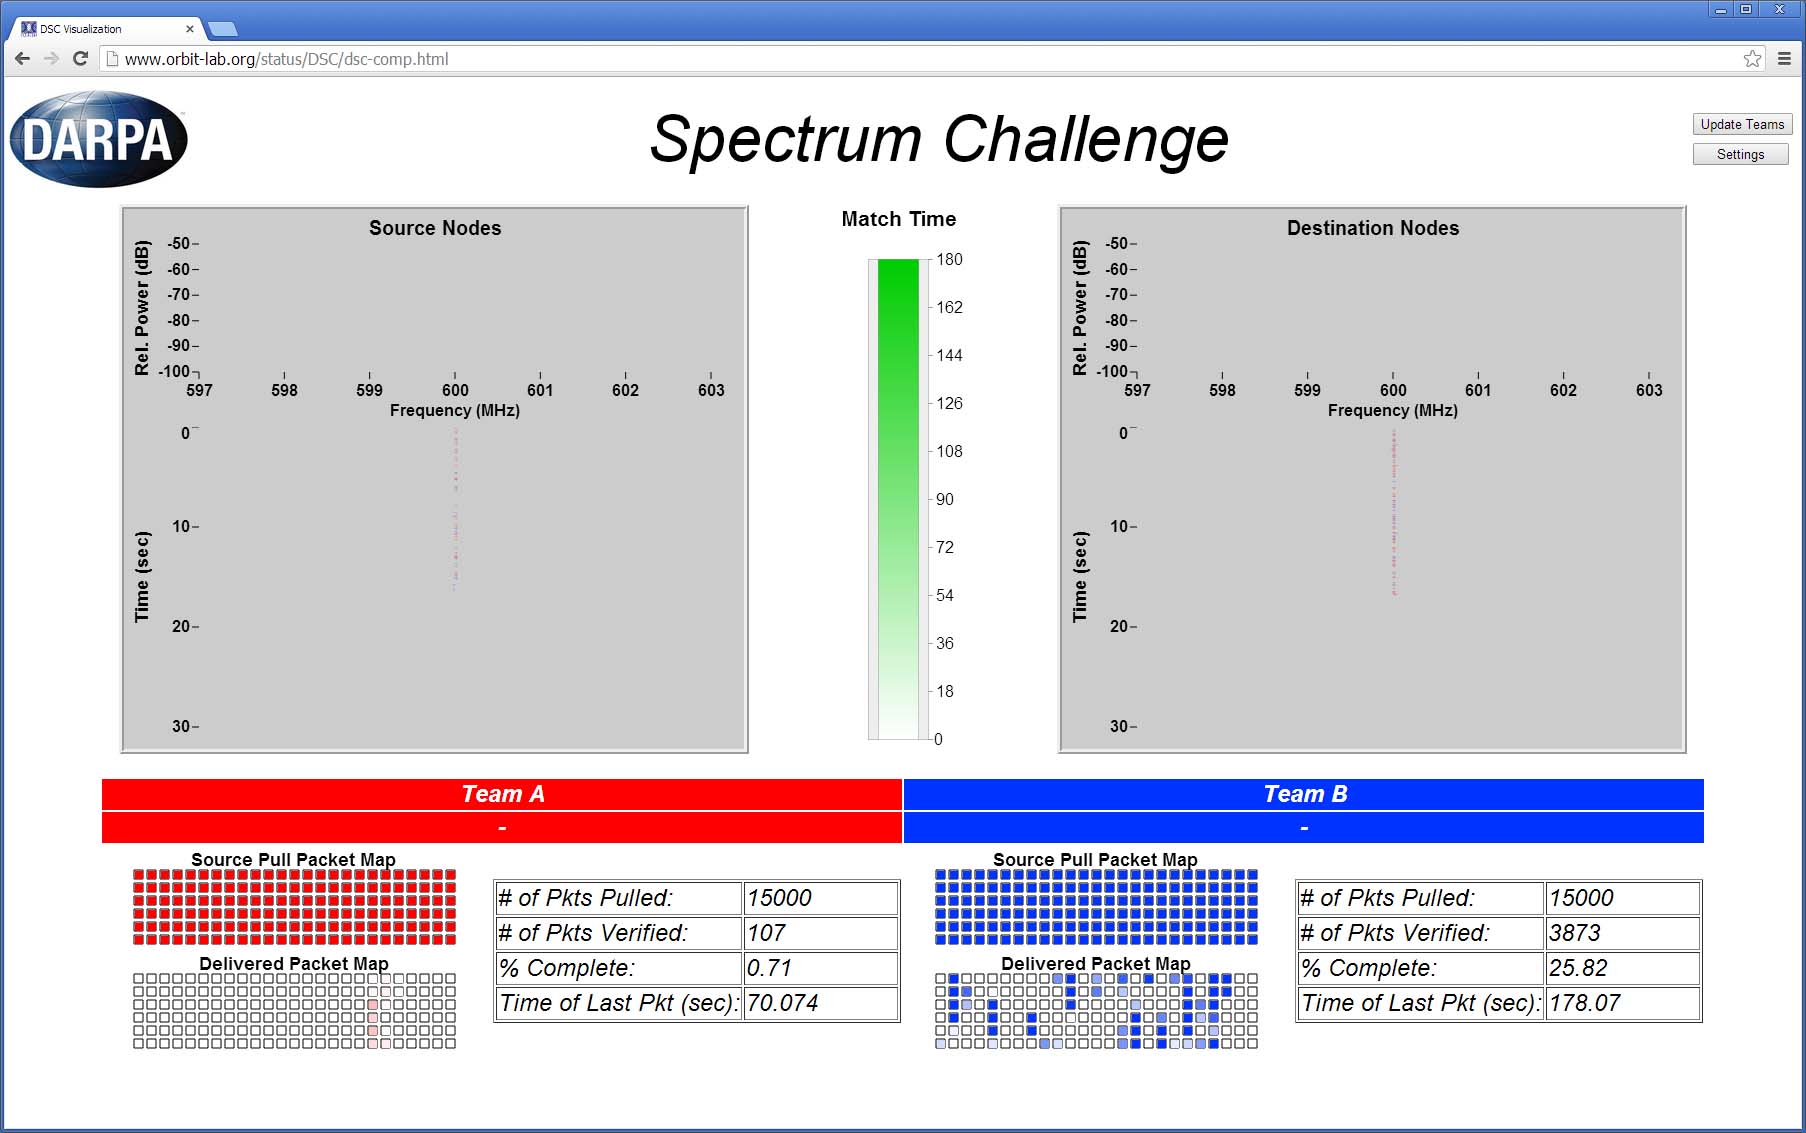
http://www.orbit-lab.org/status/DSC/dsc-comp.html.
As can be seen in Figure 1, the browser window is separated into two areas: spectrum visualization on the top and the packet server status at the bottom.
Source and destination nodes' spectral occupancy is shown in their respective panes and color is used to distinguish the teams. In between the two panes, the match time slider is used to indicate the current match time.
The bottom part of the browser window shows the state of the packet server. Each team has transmit and receive checkerboards of 6 x 25 fields where each field corresponds to 100 packets. Color saturation is used to indicate the fraction of 100 packets that were successfully processed (pulled by the transmitter or pushed by the receiver and successfully verified by the scoring server). The table in the lower right corner shows basic numerical stats for both teams.
Cooperative Match Visualization

The URL for cooperative match visualization is
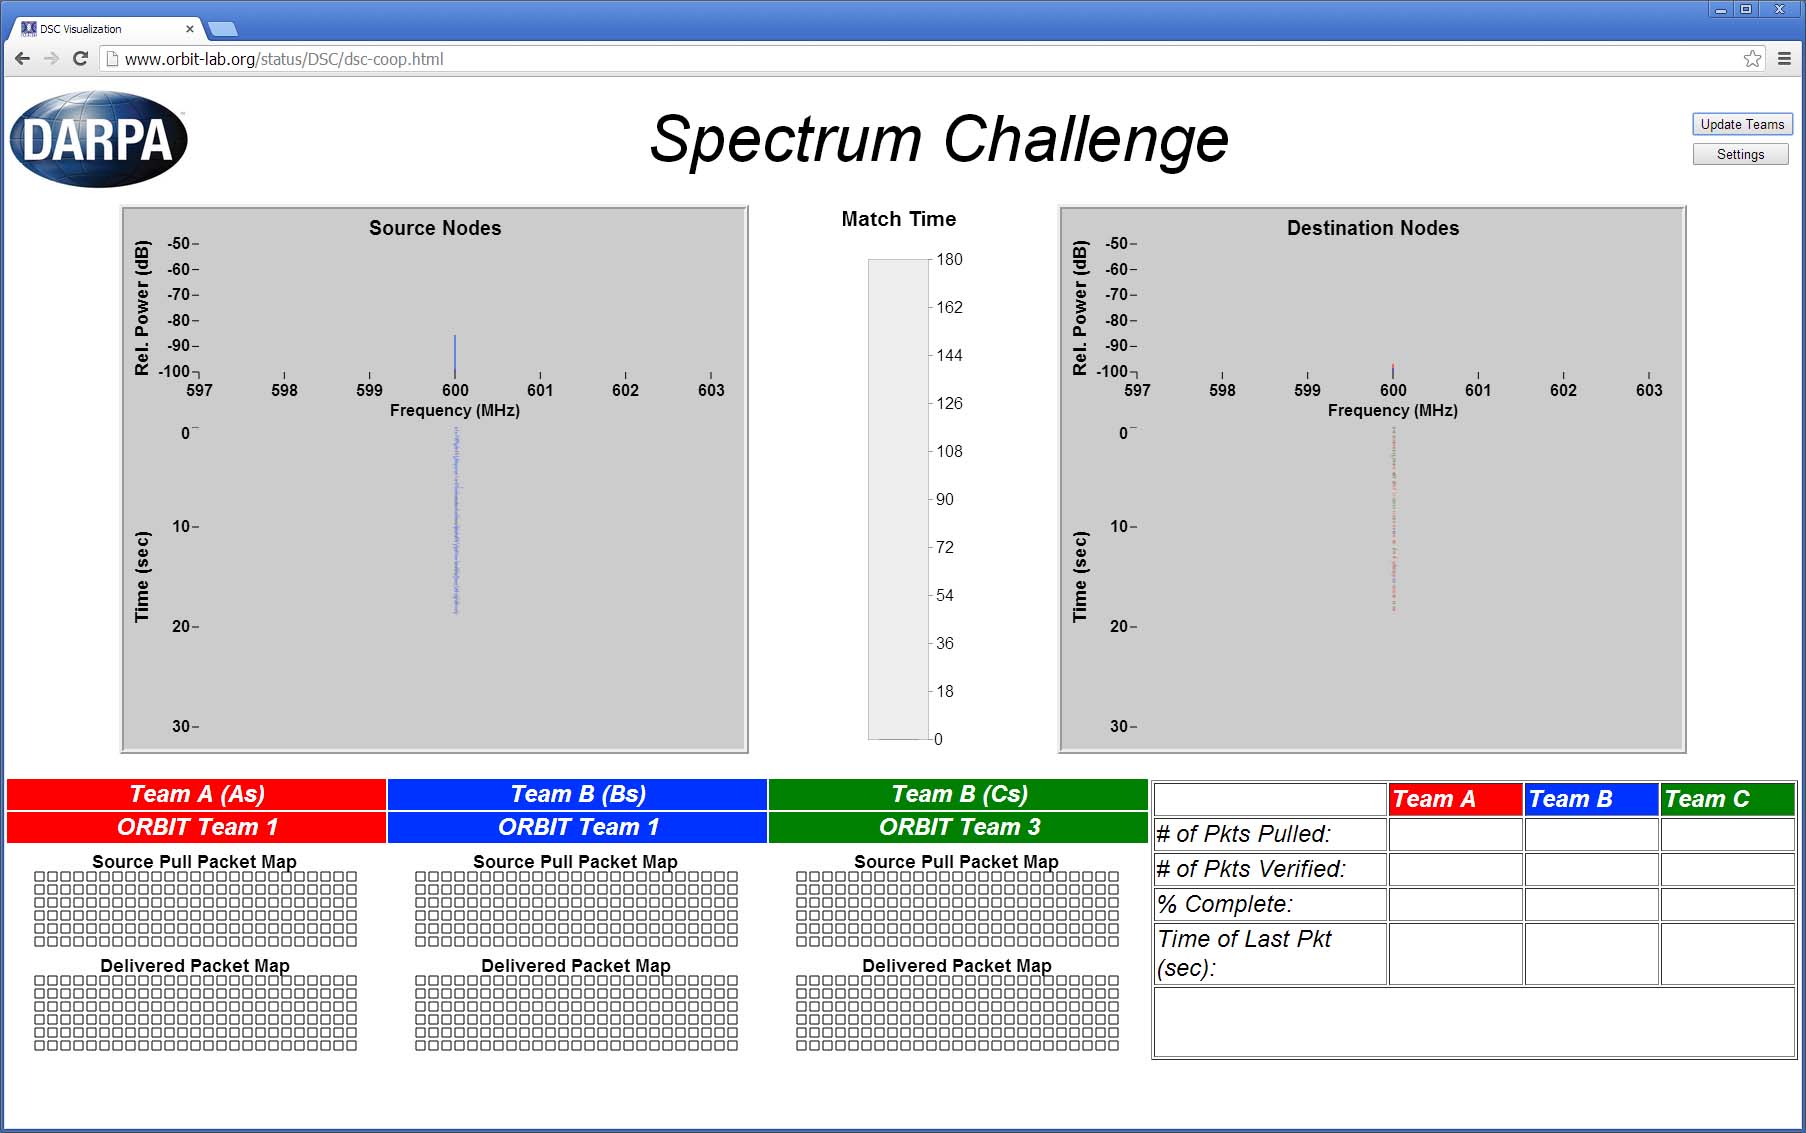
http://www.orbit-lab.org/status/DSC/dsc-coop.html.
As can be seen from the figure, the browser window is again vertically divided into spectrum visualization area and packet server visualization area. In addition to the third team checkerboards (for transmitted and received packets) in the scoring server visualization area, the scoring server statistics table also has the overall (joint) score for all three teams for the current cooperative match.
Attachments (2)
-
CompVis.jpg
(213.3 KB
) - added by 12 years ago.
Competitive Match Visualization
-
CoopVis.jpg
(230.5 KB
) - added by 12 years ago.
Cooperative Match Visualization
Download all attachments as: .zip