
| Version 23 (modified by , 11 months ago) ( diff ) |
|---|
CityOS
Project Information
CityOS is a project organized and developed under the guidance of Dr. Jorge Ortiz at WINLAB, Rutgers University. The entire goal for this project is to research how privacy is handled within data collection as groundwork for future privacy infrastructure within the contexts of smart cities and urban living. Currently, the methods of data collection are separated into three main API's, which the teams under Dr. Ortiz have been working on before our arrival. The first API, also known as On-Scene API, is where data is collected, used, and then discarded in a real-time, continuous manner. The second API, called the Single-Locality Aggregation, is a continuous data collection that is fixed to a small (localized) region. The third and final API, called the Cross-Locality Aggregation, is a citywide collection incorporating data from multiple localities and user devices.
For our summer internship, we will be focusing on the second API - The Single-Locality Aggregation.
To demonstrate how the API functions, we will be creating an end-to-end parking application that will continuously aggregate information of the parking spots here at WINLAB to train a machine learning model to predict future parking availability.
We hope this research and application will lay the groundwork for a larger-scoped data-driven citywide parking app, which will reduce vehicle congestion and improve urban quality of life.
Project Information
| Rohan Sada (Graduate student) | Steven Huang (Undergraduate Student) | Aryan Upadhyay (Undergraduate Student) | Anjali Kapilavai (Highschool Student) |
| I am pursuing my masters degree in Electrical and Computer Engineering at Rutgers University, specializing in Machine Learning. | I am a rising Junior at Rutgers University-New Brunswick pursuing a B.S in Electrical Engineering and a minor in Computer Science. I am also a 2D visual artist and graphic designer in my spare time. | I’m a rising sophomore at Rutgers University, double majoring in both Computer Science and Data Science. In my free time I compete in powerlifting and I also teach coding to kids. | I am a rising senior at Edison Academy Magnet School studying Electrical Engineering and Computer Science. I wish to pursue a career in the fields of electrical engineering and machine learning. |
Documentation
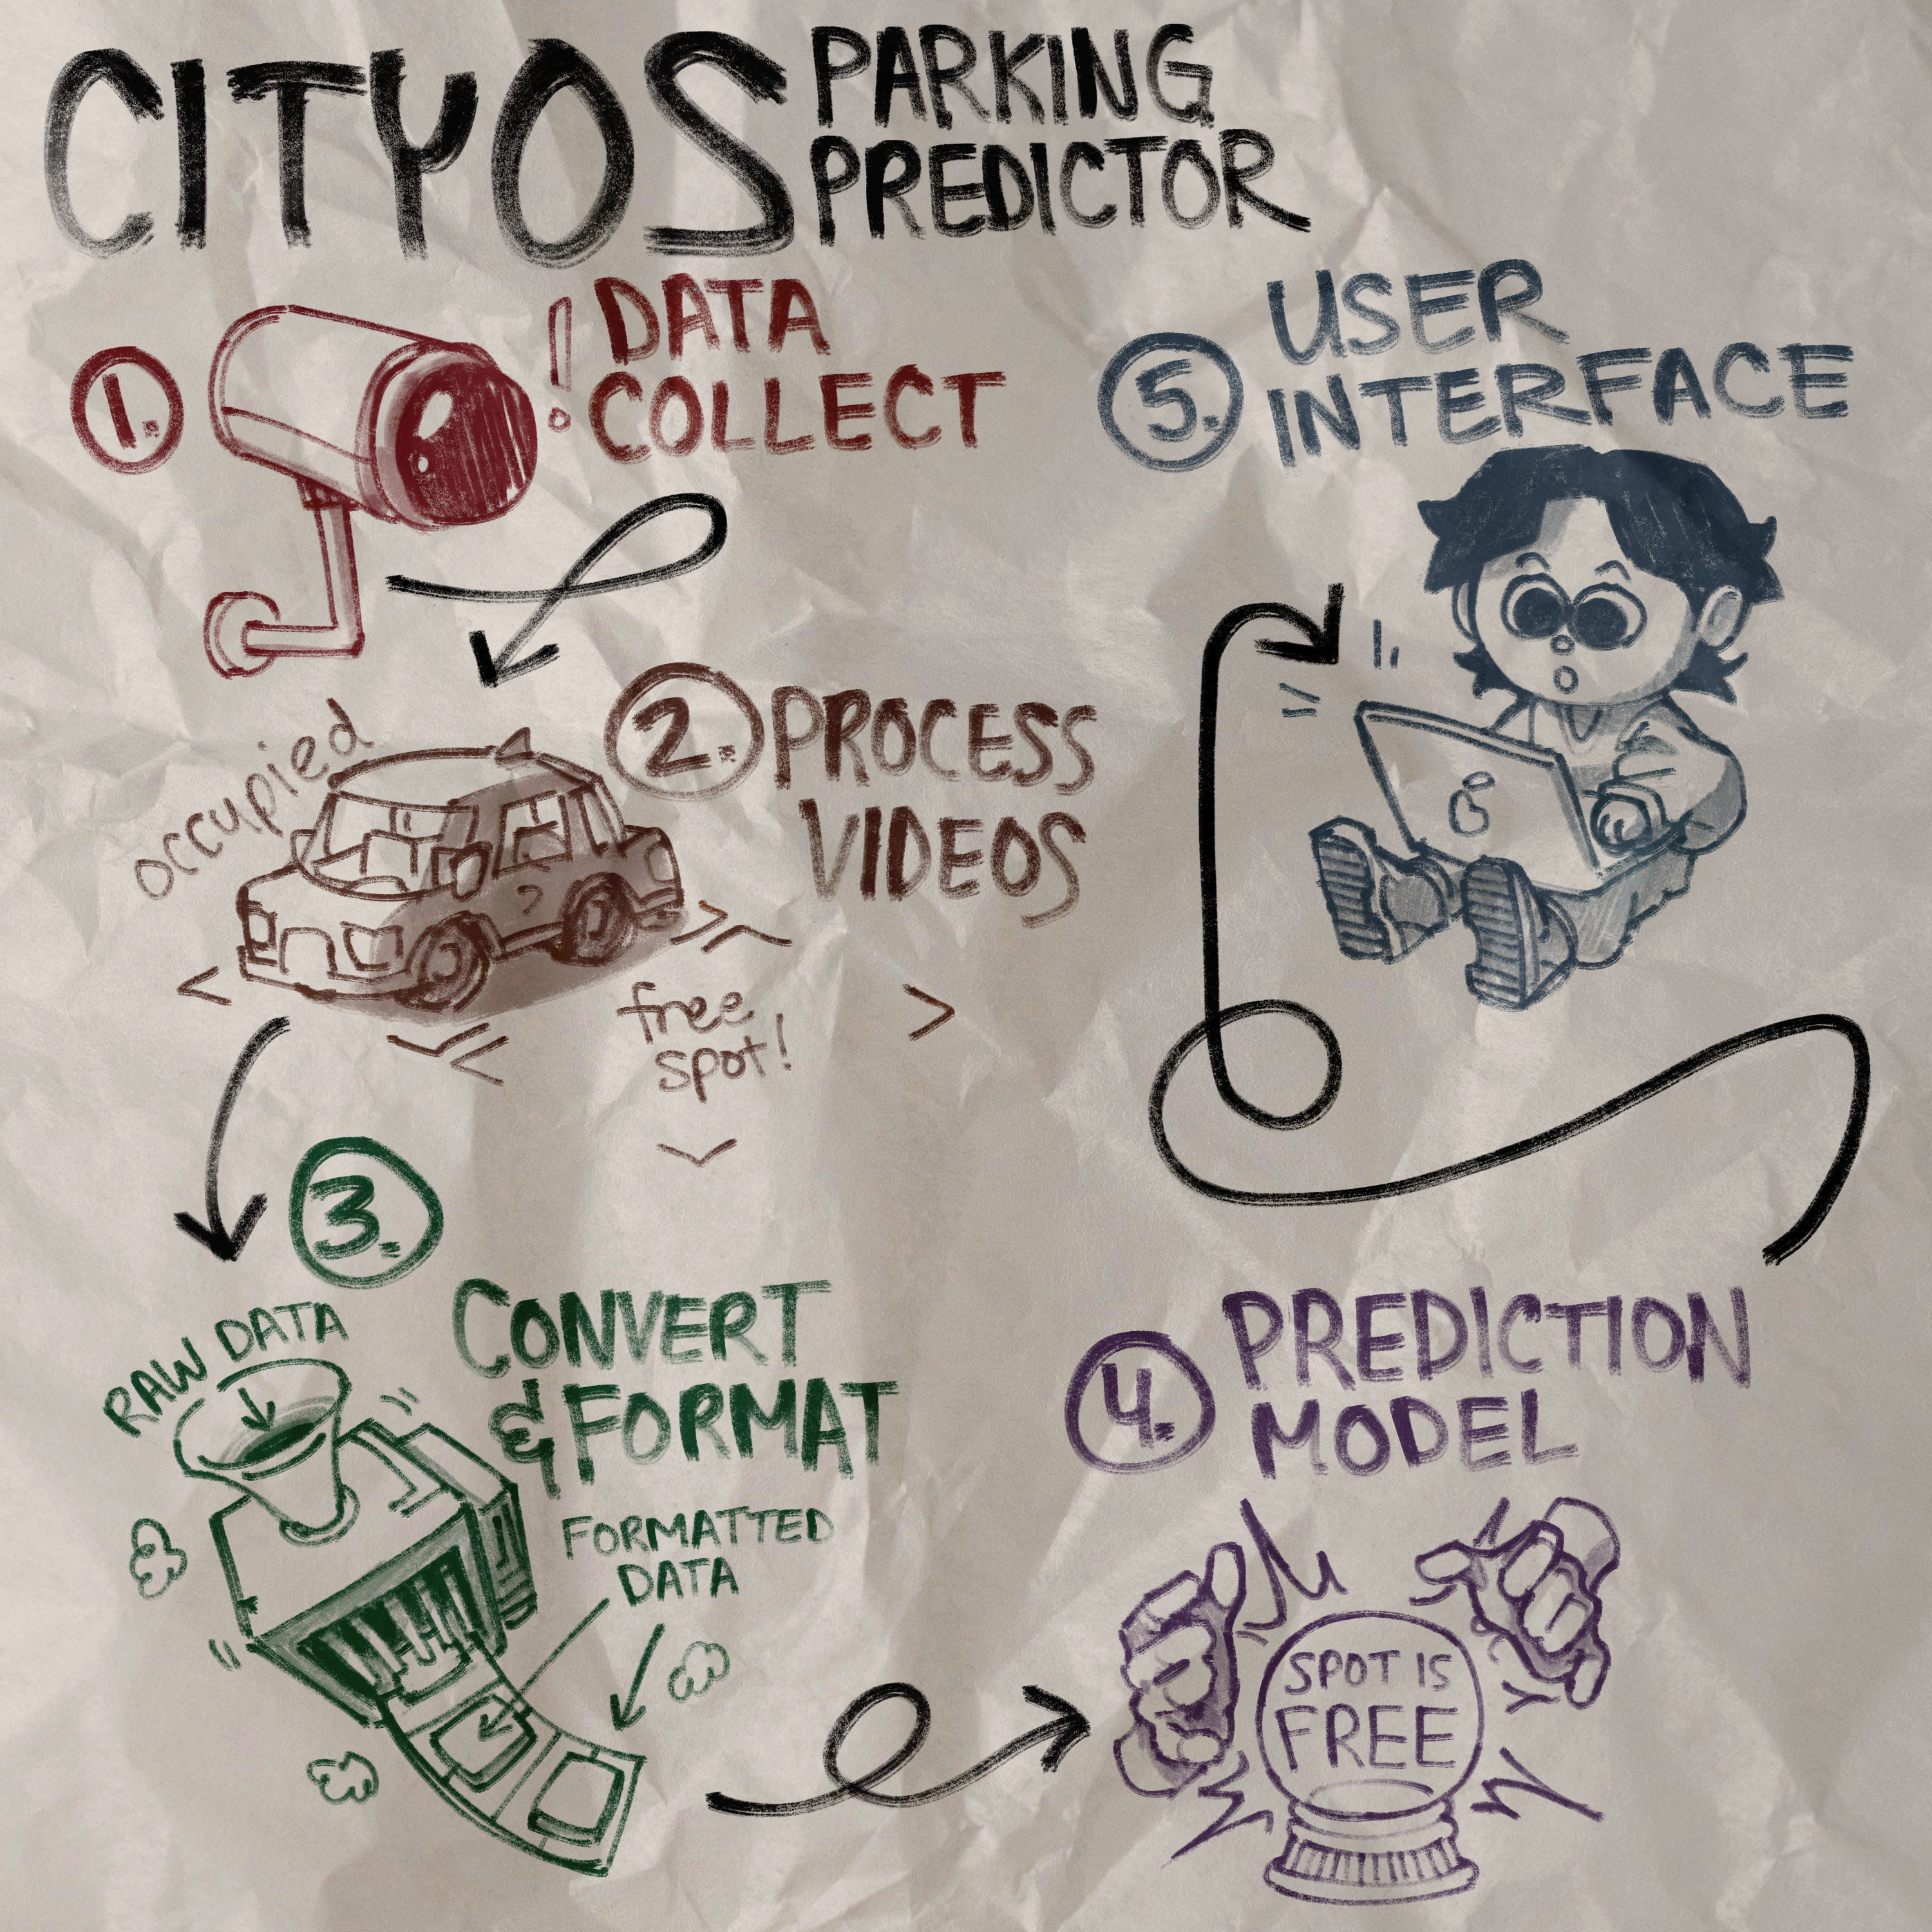
Our parking predictor application consists of 5 main components, which are the following: the Data Collection, Video Processing, Data Formatting, Prediction Modeling, and the User Interface.
 | The data collection is being done from the Rutger's Winlab Camera which is pointed into the adjacent parking lot. It collects video footage daily from 7 am to 7 pm. The video processing is where the video footage is analyzed for information. In our case, it is checking each of our 10 parking spots for availability. When a vehicle parks in any of the spots, it will return data that this spot has been occupied. We accomplished this functionality using OpenCV and YOLOv8. The video formatting is where the video data is formatted and aggregated into a CSV file. Within a line, it displays the spotID number, Month, Day, Year, Hour, Minute, Second, and the status of whether the spot is occupied or free. The prediction model is where the aggregated data is imported in order to train and teach a machine learning model. In our project, we are using a Random Forest model, which will take the data and use it to predict the occupancy given a spotID and a time. The user interface is where people can interact with our systems. We are planning to implement a large interactive UI where users are able to see a mock replica of the parking lot and are able to then select and visualize parking lot occupancy over the days and weeks. |
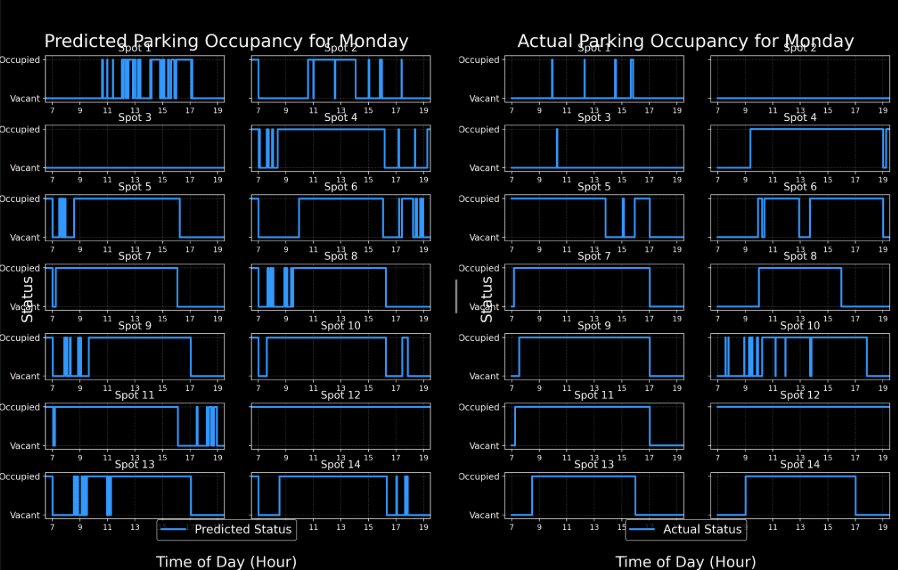
The graphs on the right are the comparisons between the predicted parking occupancies generated by the machine learning model in comparison to the actual parking occupancies of that day. It is separated by each parking spot. The type of model we decided to use for this project is called a Random Forest model. This model comprises of much smaller models called decision trees. These decision trees act as a series of yes/no questions which is used to categorize data. An example would be:
A single decision tree will try to predict by asking these kinds of questions to break down the data step-by-step. Although a single tree is simple and easy to follow, it tends to overfit, meaning it memorizes the training data instead of generalizing. As such, instead of relying on just one decision tree, a random forest builds hundreds or thousands of these trees, each with a random slice of the data and a random subset of features/questions. This makes it so each tree will make slightly different predictions. In the end, the final verdict is either based on the majority vote of the trees or an average of values, depending on the required output. In our case since we are classifying the occupancy of spots, it returns the majority vote. | 
|
Weekly Progress
Week 1
- Met with Dr. Ortiz to define project scope.
- Began researching and learning about data regression models.
- Reading documentation on similar works.
Week 2
- Drafted the detailed system design document.
- Obtained video feed of the parking lot and applied YOLOv8 for object detection.
- Outlined the system architecture, including the Data Logger, ML Model Trainer, and Prediction API.
Week 3
- Implemented and tested three initial ML models: Linear Regression, Naive Bayes, and Gradient Boosting.
- Achieved initial prediction results on sample data.
- Began learning about Decision Tree and Random Forest algorithms for future implementation.
Week 4
- Implemented and tested Decision Tree and Random Forest ML models.
- Created the website, which holds documentation and the web app.
- Continued with data collection and aggregation for ML models.
Week 5
- Created and filled the design documentation section of the website.
- Designed a mock-up layout of the web app with components.
- Collected and imported more data, as well as correcting some overfitting with the model
- Ran RandomCV and GridsearchCV across multiple folds for optimization and cross-validation
- Generated occupancy histograms per day to visualize trends in each lot
Week 6
- Created 3D model assets of vehicles for the web app.
- Generated occupancy graphs from the machine learning model.
- Continued collecting more data to train the model.
Week 7
- Implemented a finished rough layout of the parking web app and connected it to the website.
- Analyzed graphs outputted by the Random Forest's prediction and the actual camera detection of that day.
- Conceptualized an expansion of the project utilizing more of the parking lot, which requires a new detection model not based on bounding boxes or points.
Week 8
Week 9
Week 10
Other Information
Attachments (6)
- CityOS-Design Flowchart.png (11.5 MB ) - added by 11 months ago.
- PredictorModel.png (219.3 KB ) - added by 11 months ago.
- StevenH.png (392.8 KB ) - added by 11 months ago.
- RohanS.png (493.2 KB ) - added by 11 months ago.
- AryanU.png (286.2 KB ) - added by 11 months ago.
- AnjaliK.png (451.0 KB ) - added by 11 months ago.