
| Version 8 (modified by , 9 years ago) ( diff ) |
|---|
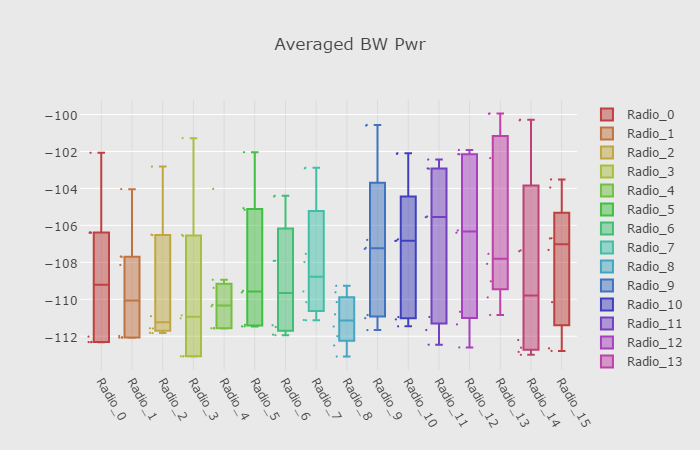
Multi Channel Sample Processing & Visualization
In this example we'll boxplot the received signal strength from several USRP channels on the MIMO rack.
Hardware / software resources utilized
1) upto 16 USRPs on the grid's MIMO rack
2) controller node (ie. node21-1) imaged with ubuntu-14-04-64bit-uhd-003.010.001-gnu-3.7.10.ndz
3) OML - Orbit Measurement Library to record measurements into database
4) rf_hw_intf - application to configure a set of USRPs for receiving samples at a specified frequency, samples rate, gain, etc…
5) sigproc_avg_bw_pwr - application for processing received samples and writing in OML database
Receive multi channel signal for processing and plotting
1) From the grid console, image the controller node then turn on all the USRPs (on the MIMO rack) and the controller node.
nilanjan@.grid:~$ omf load -i nilanjan@.grid:~$  -t node21-1
nilanjan@.grid:~$ omf tell -a on -t [[21,1],[23,1..8]]
2) Set up tunneling via ssh from your local port 5100 to the grid.orbit-lab.org:5100
my_laptop> ssh -L 5100:grid.orbit-lab.org:5100 username@grid.orbit-lab.org
3) Verify that Webproxy is running (this is required for remote web based streaming)
nilanjan@.grid:~$ run-websock 5100 localhost:5101 --daemon
WebSocket server settings:
  - Listen on :5100
  - Flash security policy server
  - No SSL/TLS support (no cert file)
  - Backgrounding (daemon)
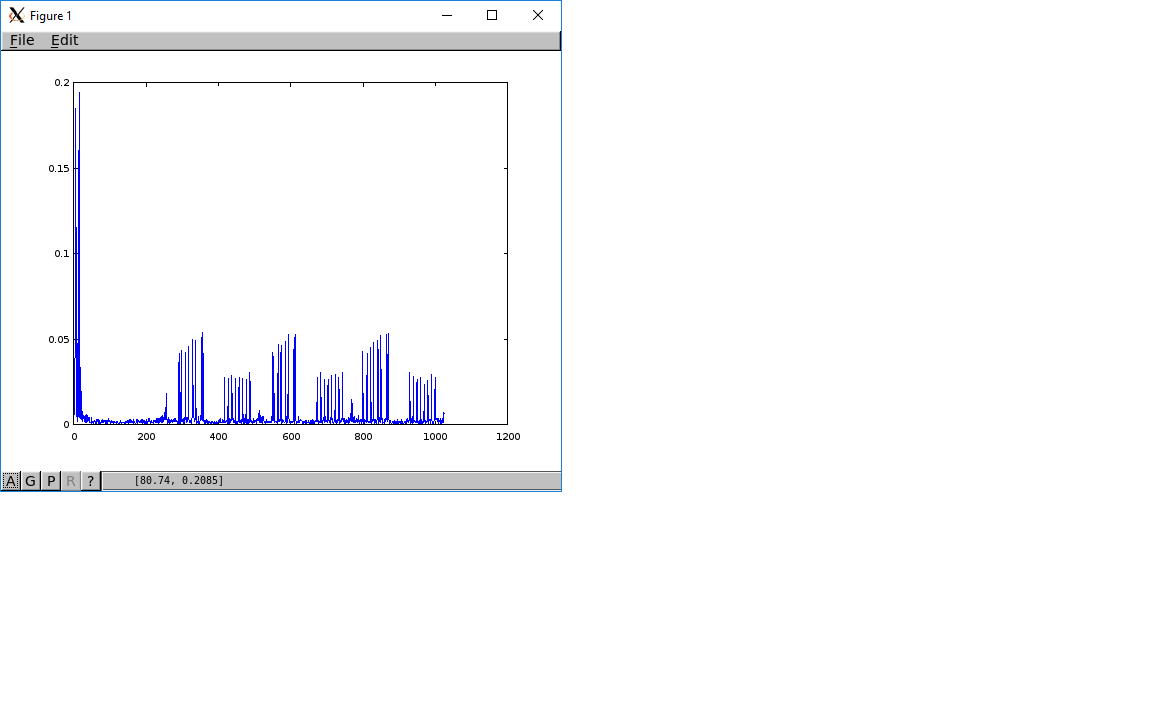
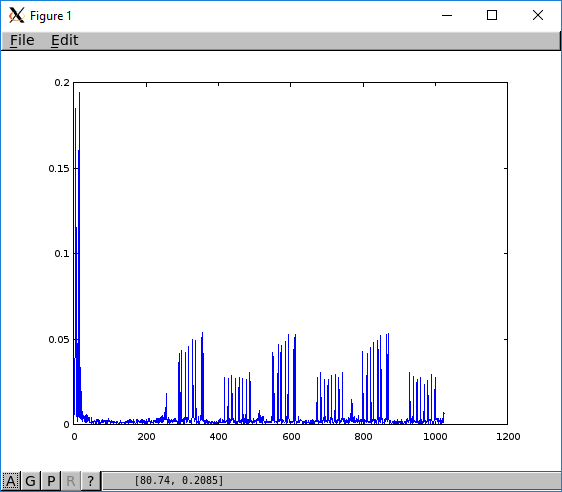
4) Open a ssh session into the controller node and run the hardware interface application to start streaming the receiver.
root@node21-1:> ./rf_hw_intf --conf "mimo1.xml,/devices/mimo_rx" --rx-only --cmd-port 5111


linux; GNU C++ version 4.8.4; Boost_105400; UHD_003.010.001.000-0-unknown

 INFO  10:31:34.189 (rf_hw_intf.cpp:820) - Starting command server at 5111
Creating the usrp device: addr0=10.10.23.1,addr1=10.10.23.2,addr2=10.10.23.3,addr3=10.10.23.4,addr4=10.10.23.5,addr5=10.10.23.6,addr6=10.10.23.7,addr7=10.10.23.8,
-- X300 initialization sequence...
-- Determining maximum frame size... 7972 bytes.
-- Setup basic communication...
-- Loading values from EEPROM...
-- Setup RF frontend clocking...
-- Radio 1x clock:200
:
:
:
........ INFO  10:30:18.921 (rf_hw_intf.cpp:640) - rxchan all
 INFO  10:30:18.921 (rf_hw_intf.cpp:713) - rxchan 0 4000000000 4000000 20

 INFO  10:30:18.922 (rf_hw_intf.cpp:713) - rxchan 1 4000000000 4000000 20

 INFO  10:30:18.922 (rf_hw_intf.cpp:713) - rxchan 2 4000000000 4000000 20
5) Open another ssh session into the controller node and run the sample processing application. This application measures the average bandwidth power of the received samples and writes the measurements into the OML database.
root@node21-1> ./sigproc_avg_bw_pwr --time 100
:
:
TCP connection to localhost:5111 ready!
Feb 14 10:18:52 INFO    OML Client V2.10.1rc [Protocol V4] Copyright 2007-2013, NICTA
[15.8042]
64k fft, mag, norm, sum-----total time 0.00127201
ch: 0 --- avg pwr = -112.993
INFO    OmlNetOutStream: attempting to connect to server at tcp://oml:3003
64k fft, mag, norm, sum-----total time 0.00111798
ch: 1 --- avg pwr = -112.681
64k fft, mag, norm, sum-----total time 0.00106562
ch: 2 --- avg pwr = -112.759
64k fft, mag, norm, sum-----total time 0.00106355
:
:
INFO    tcp:oml:3003: Waiting for buffered queue thread to drain...
Done!
6) Run the box plotting server on the console. This server will query measurements from the OML database and forward to webpage display.
nilanjan@.grid:~$ box-plot-server --port 5101 --file /var/lib/oml2/measured_avg_bw_pwr.sq3

 INFO  11:39:00.355 (main.cpp:240) - Starting the server at
 INFO  11:39:00.356 (main.cpp:179) - Starting command server at 5101
7) Finally if everything is working correctly, the measured power across different channels can be view from a Chrome browser - click me :)

Attachments (5)
- view_sync_sig.png (16.4 KB ) - added by 10 years ago.
- view_sync_sig.2.png (10.0 KB ) - added by 10 years ago.
- mimo_rx.png (49.1 KB ) - added by 9 years ago.
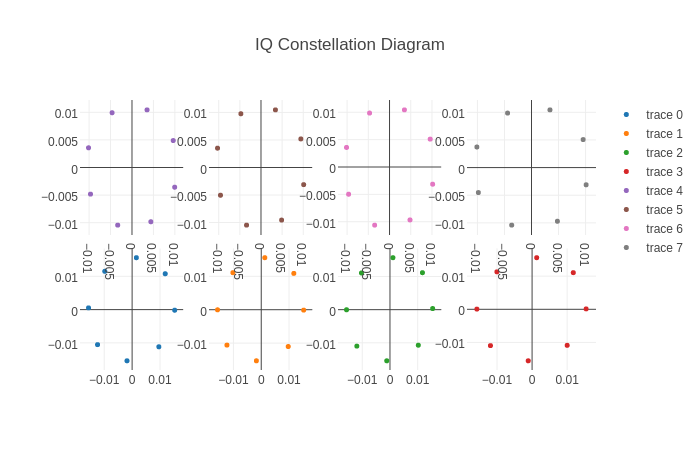
- mimo_rx_scatter.png (40.7 KB ) - added by 9 years ago.
- js_scatterplot.html (6.0 KB ) - added by 9 years ago.
Download all attachments as: .zip